This article is written not for specialists in computer vision and machine learning, but for those who work with facial recognition biometrics and face recognition systems, but may not have a specialized education in this domain. Such individuals include account and project managers, SW engineers who deploy the systems, architects, and, of course, customers and users of such systems, who must make decisions without necessarily having a deep understanding of how face recognition algorithms actually work.
In this article we will consider the main stages of face recognition: face detection, image align- ment, template extraction and matching. We will try to explain the essence and basic principles of the inner workings of neural network algorithms, using language that is easy to understand and focusing mostly on those parts that are important for the evaluation and comparison of algorithms. The intent of the article is to focus on interesting details that are well known to ma- chine learning engineers, but are often skipped or missed by customers and managers while at the same time avoiding long, boring academic explanations about fundamental biometric concepts as well as higher math.
(If you have a mathematics background and want to explore more on the subject, there are hyper links in the paper that will direct you to more detailed descriptions of some of the methods and subjects).
Face detection
The very first step in face recognition is finding a face or faces on an image. The process of face detection can result in two types of errors:
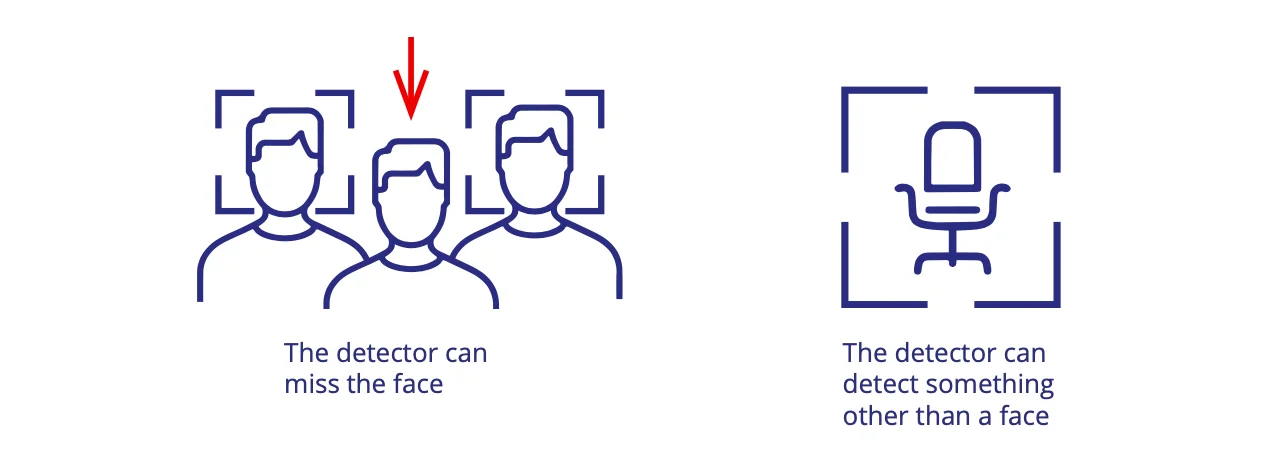
The detector generates a score, which can be between 0 and 1 or any other metric that reflects the level of confidence of the algorithm that the object detected is a face or not. This score
is adjustable such that the user can choose an acceptable balance between the two types of errors. Sometimes a developer can fix the threshold inside of the Software Development Kit (SDK) that adjusts the effect of the two types of errors such that in his best estimate there is only a fine line between the two types of errors.
Ultimately, it is up to the customer to decide whether it is more important not to miss any face or not to be littered with clutter. However, there are two major tasks for which the first type of error is more important than the second type.
1. Expert work. This type of task represents all applications in which an expert
is using face recognition in so-called manual or semi-manual mode. In other words, an image is uploaded and is searched against a database. These applica- tions are primarily used in forensics, police investigations, passport control, etc. For such applications it is more important not to miss a face even at the risk
of false detections. In most cases a user can manually confirm or choose a detected face and simply ignore all false detections. False detections in this use case are deemed not harmful.
False detection on the image. Next to the boundaries the confidence score.
2. Recognition on-the-fly. This type of task represents applications that carry out face recognition from on-line cameras or during batch processing of a large amount of data, and processing of data is done in automated mode. In these cases, though it is also suboptimal to fail to detect a face, false detec- tions are not harmless in these cases either. First, captured “clutter” (extremely poor quality faces or foreign objects) can interfere with the recognition results and give false matches. However, a good facial recognition biometrics algorithm can usu- ally handle this condition. Second, and a more cumbersome problem, falsely detected objects require further processing and load on the system. This sit- uation can become quite important when working with a huge loaded system with significant amount of incoming data and high number of records in the enrollment databases. The number of servers and the associated costs can be a hindrance if not prohibitive. As such, for these situations a better trade-off between false detections and missed faces is required.
 is missed.")
Almost all faces are detected, no false detections, but one face (small and partially occluded) is missed.
How face detection works
Before the neural network “revolution”, the classic algorithm for face detection was based on the Viola-Jones method, which was first proposed in 2001. Simply speaking, the Viola-Jones algorithm worked like a small box, sliding or “scanning” the frame and searching for face fea- tures. These signs were “developed” and coded by a developer.

Viola-Jones method
However, once neural networks entered the market, though the principle of “scanning” and classification remained the same, the features were automatically chosen by a neural network itself. As a result, detection based on neural networks became more accurate. However, the scanning method like Viola Jones became quickly outdated. One of the major drawbacks of the scanning method was the time constraint. The method was not very fast and the time required increased linearly as a function of the resolution frame. The speed of old fashioned detectors that used Viola-Jones and AdaBoost was in the order of 20-100 ms, depending on frame size.
Followers of a “traditional” approach often argued against the use of neural networks for face detection. They argue that because it is heavier and speed is increased only with a GPU, the simple task of face detection becomes quite “expensive” in terms of computing power and performance.
However, the most recent neural network methods debunk these arguments. Nowadays, a neural network does not slide over an image, analyzing it piece by piece, but rather projects a net over the image and analyzes it as a whole. In this way, the neural network is able to make predictions about specific regions of the image where a face might be. The method is more complex, and takes into account results of neighboring “regions”. It can also be a single-pass or double-pass approach with extra classification algorithms, double-checking detected areas for face signs.
Modern neural networks

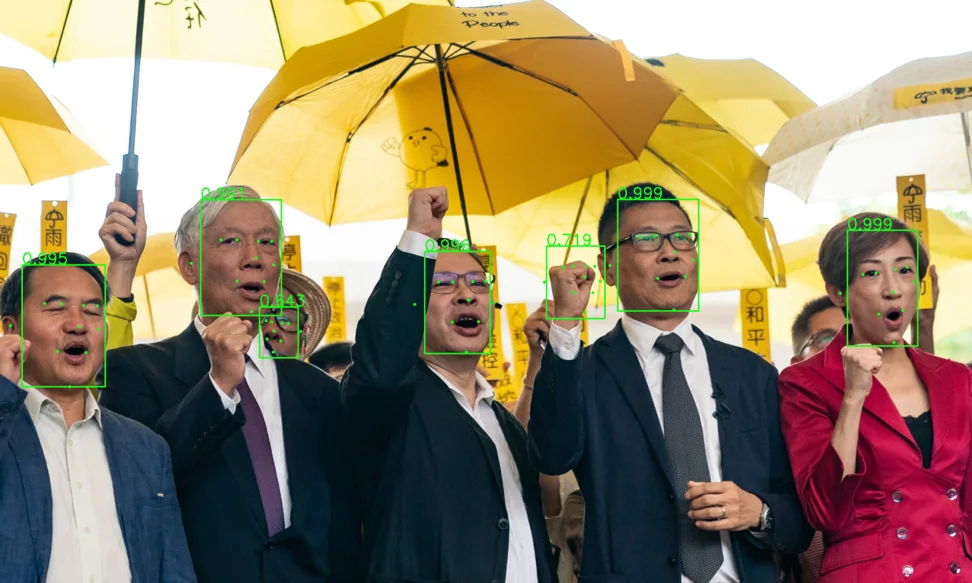
This approach neutralizes the impact of image resolution on detection speed and makes it, not only very accurate, but also fast without putting too much demand on resources. In addition, neural networks work much more accurately on “wild” images that may have different views, occlusions, and artifacts.
Modern face detection algorithms are much faster on GPU than on CPU and its speed can be as fast as 1–3 ms per frame or 400+ frames per second on single GPU. As well as facial recognition biometrics, face detection algorithms can be pretty heavy and much slower than the num- bers above, but very accurate. In most of real use cases such level of accuracy if not needed and heavy algorithms are used mostly for competitive contests.

Neural network face detector: all faces are detected despite angles, size, and occlusions.
Alignment

The anchor points, or landmarks, on the face
Alignment is rarely discussed although it is a very important part of the face recognition process. Alignment is needed for the stan- dardization of images to prepare them for fur- ther processing by the recognition algorithm. The capabilities of modern face recognition technologies are impressive. They successful- ly work even with highly unformalized data, including faces that are turned, occluded, morphed, have been altered with make up, have different sizes and positioning, are of different ages, and are of different qualities. Nevertheless, a recognition algorithm still needs some anchor point in order to unify all input images. Alignment does exactly that. It finds control points on the face and puts all images into a standard position, thus making recognition easier and more accurate.

Input image
The more accurately the landmarks are po- sitioned, the more accurate face recognition will be. Alignment algorithms do not neces- sarily use as many landmarks as shown in the picture. As few as 4 or 6 points could serve as landmarks.
Before neural networks were used for recog- nition, traditional algorithms usually estab- lished only 2 points, namely both eyes, and as such, only permitted the recognition of frontal images. Modern technologies use alignment based on neural networks that detect several landmarks, and they are trained to work with many different images, which are often far from the “ideal” frontal position.

Images after face detection and alignment
Accurate detection and alignment is at least 50% part of the success when working with uncon- trolled (“wild”) images. This is the case because alignment literally tells the next stage of tem- plate extraction “extract from here, that’s the face”. If the alignment is wrong, face recognition will not be successful.

Examples of good alignment despite big angles and occluded eyes. The lines are at the place where the eyes are supposed to be. The eyes are always in the same position in the frame.
In face recognition, despite good detection and alignment algorithms, things can still go wrong and 100% accuracy is not yet guaranteed.

Examples of incorrect alignment
Face recognition itself: Traditional “Engineered” Algorithms versus Neural Networks
In general, once a face in a photo has been detected and the images have been prepared, the task of machine face recognition begins. Face recognition consists of 4 basic consecutive actions:
- Input data. This is the data that makes up the facial image detected.
- Descriptor. The raw data from the facial image is converted into machine language to permit the creation of an algorithm that turns the image into a descriptor.
- Prediction. The descriptor, and hence the face, is compared against other faces to determine how similar they are to each other.
- Assessment and adjustment. The results of the comparison are assessed and corrected to improve the accuracy of the algorithm.

These four steps have been employed since pioneers in the field of machine vision first imple- mented them in the early 90s. Modern developments on neural networks and deep learning methods are also based on this same sequence of actions, and starting in about 2015, neural network face recognition algorithms have almost completely replaced traditional “engineered” face recognition algorithms. An important difference between traditional and facial recognition biometrics neural network driven face recognition has to do with the stage at which the input data is transformed into a descriptor. In traditional face recognition, the descriptor is set by a human developer. In con- trast, the neural network algorithm is established by a machine.
The developer of machine vision algorithms always knew how the descriptor was formed. In other words, the developer invented the “rules” for its extraction. The work can be generally described as follows:
- The “weight” of each pixel (or area on the image) was calculated, taking into account the mutual influence of weights on each other.
- A mathematical model based on these weights that described the original image was created. The developer always knew what methods were needed in order to calculate the “weights”.
Methods such as Gabor, LBP, HOG filters and others were popular. Sometimes developers came up with “author” variations of existing filters, and sometimes they developed completely original approaches to come up with a new type of algorithm.
Though the neural network approach is based on the same principle, a significant difference between this method and the traditional method is that the pixel weights and the methods by which they are obtained are generated by the neural network itself rather than a human. This difference revolutionized computer vision algorithms, making them even more efficient for facial recognition tasks than human brains.
How does a deep convolutional neural network work?
At its core, the neural network is a black box, where artificial intelligence is responsible for decision-making, and a developer acts as an architect of this box, changing the settings and feeding different input data to the box. As such, the developer attempts to improve the output without being privy to the inner workings of the black box. In most cases, it is the function of the developer to provide the neural network with preprocessed images of the same size and in which the face is aligned in the same position in the frame. After alignment, the image is brought to a universal coordinate system and formalized for “understanding” by the machine. This process is called “normalization”. The RGB values1 of each pixel are converted to numbers from -1 to 1, yielding a fairly large set of numbers that characterize the face. These numbers represent the input of the neural network.

Classic AlexNet architecture
The neural network consists of a number of layers that usually vary from tens to hundreds, but in some cases can reach even thousands. In addition, each layer can have a number of con- volutions. The number of layers and convolutions is determined by the network architecture, for example ResNet, SENet, AttentionNet, AlexNet and others. Developers of facial recognition algorithms can change the architecture; however, a customized architecture does not automat- ically mean that the algorithm works better. As a rule, commercial developers do not usually disclose the architecture they work on, except occasionally as part of scientific publications. In any case, information about the network architecture does not necessarily provide a greater understanding for customers and users as to how well the algorithm works.
Once the neural network receives information about a facial image in a number format, the network then begins to process these data by assigning weights to the different areas of the image. Convolution within a layer of the neural network transforms the input data. After the transformation at one layer, the data is then transferred to the next layer. As the data is moved from layer to layer, the total amount of data can increase or decrease. How the data is trans- formed is determined by the neural network architecture.
What is deep learning?
In order to answer this question, we must understand what happens inside a neural network. Most commonly the first layer of the neural network is devoted to batch normalization. Batch normalization is a linear transformation of the data into a form that is more convenient for a network to work with. After batch normalization, the neural network is able to process the data much faster, which makes the training process faster.
At each subsequent layer, the data go through different linear transformations, each of which can be quite complex. Developers can usually follow what is happening with the image across the first few layers. For example, there is often a transformation similar to the Gabor filter used by developers 10 years ago. However, it is much more difficult to figure out what trans- formations take place in the deeper layers. Thankfully, understanding what is happening at the deeper layers is meaningless from a practical point of view. That is to say, though it would be possible to see intermediate images, which are at that point transformations of the original image, what would remain unknown is how the neural network chose the specific weights and made the transformations. The situation is complicated further by the fact that a nonlinear transformation is added to the complex linear transformations inside each layer when the net- work transfers the data between layers (see details here: Max pooling and ReLu methods). The nonlinear transformation directly illustrates the answer “This is magic” to the question “How does it work?” It is very difficult to explain why, for example, equating all values below zero to zero and multiplying all values above zero by some coefficient will have a positive impact on the accuracy of facial recognition. However, this is exactly what happens, even though no one has yet answered why.
The last output layer of the neural network contains the descriptor, which is usually a vector in multidimensional space, and simply put – is a set of numbers. This set of numbers is a compact description of each face, and is called a biometric template. The network can now compare
the received descriptors and begin to make assumptions about which descriptors belong to the same people. It then checks whether it is correct or not based on the tagged database it initially received as an input, and in which there were a number of images of the same person tagged in a way to indicate which images belong to which person.
So how does the neural network “work the magic” to be able to recognize faces correctly? Truth be told, after the first cycle, the recognition accuracy of a neural network is not much better than a coin toss. However, as the optimization process proceeds, a given neural network will go through hundreds of thousands, and sometimes millions of cycles of training with weight corrections in order to “learn” the common features of the faces of the same people and begin to “understand” which images from the training dataset belong to one person and which to
a different person. Training stops when the neural network’s recognition accuracy ceases to improve. The final algorithm, namely the way in which weights are assigned and the descriptor is formed, will work with faces that have never even been in the training dataset. The formula by which the network changes these weights is called the loss function, and represents the error associated with the difference between the actual output and the predicted output. The selection of the correct loss function is one of the main tasks in the development of facial recognition algorithms. A developer can tell you what network architecture he uses, but most probably he will tell you nothing about his loss function.
It is of interest to note that the network can also overtrain itself. At a certain point in the learn- ing process the recognition accuracy of the neural network can actually become worse rather than better. For this reason, developers control the training process by constantly validating in- termediate results on the test databases. The neural network may also “memorize” its training dataset at 100%. In other words, it will be able to recognize faces from this dataset with 100% accuracy. However, when this happens the neural network will also be worse at recognizing unfamiliar faces. In machine learning theory, these phenomena are called generalization ability and overfitting, respectively and refer to the fact that the network has learned too many partic- ular features that are unique to individuals, but are not common to human faces in general.
What is a biometric template?
As previously mentioned, in order for recognition to occur, the image of a face must be turned into a descriptor, or biometric template. The different biometric templates will be matched to each other, and based on how similar they are to each other, the system will produce probabil- ities related to the match in facial recognition biometrics systems.
Templates of “traditional” algorithms are very different from the templates generated by neu- ral networks algorithms. “Traditional” templates were weighted substantially more and usually were not a set of numbers, but equations, which needed to be calculated. For the human de- veloper it was not easy to reduce a huge number of weights and intermediate image descrip- tors into one compact vector. In order to match two templates, it was necessary to perform calculations, and this required more time and computational power than just comparing a set of numbers.
Before the appearance of neural network algorithms on the market, the matching operation, which required searching the database, was resource-intensive. The problem of slow matching speed was compounded by low accuracy. The algorithms were practically inoperative on big databases with millions of faces due to a very high false rejection rate (FRR) at false acceptance rate (FAR) on the order of 10-6, making processing speed not even the primary issue. No one
at that time could have imagined that one day millions of comparisons per second would be carried out on one processor core as it is now.
In addition to the vast improvement in processing time, neural networks not only improved recognition accuracy, but also made the biometric template lighter by an order of magnitude or two. Increased recognition accuracy and light templates that can be matched at high speeds have made it possible for facial recognition systems to work with national databases of hun- dreds of millions or even billions of people. The difference between “traditional” and neural network algorithms has become the difference between the first-generation and modern com- puters: the neural network algorithm is incomparably more efficient, faster and cheaper.
As mentioned previously, a neural network pattern is typically a vector, or an ordered set of numbers such as binary numbers or floating point numbers. Though the biometric template usually weighs 0.5-5 Kb, it does not mean that there is little information encoded on it. For exam- ple, a biometric template of 96 floats weighs only 384 bytes, or 3072 bits. Therefore, a biometrictemplate encoding one person’s face can be represented as a number of almost 2000 digits, and the number of such possible numbers is 2 ^ 3072. Unfortunately, developers do not know exact- ly what is encrypted in these numbers, as they are generated by a machine. So, does this mean that it is impossible to extract useful information from a biometric template if even the developer does not know what is encoded on it? The answer is for the most part “yes”.
Although theoretically biometric templates describe a person’s face, and – theoretically – they can be considered as “personal data”, in practice it is “personal, but absolutely meaningless code”. There is a possibility to “decrypt” templates in a way. You should have the algorithm that built the templates, huge database and highly qualified researchers. After research you could be able to “synthesize” the images from the templates, but these images will be nothing like originals. Moreover, the better the recognition engine, the harder to restore the image from the template. At best, the synthesized photo will be a bit similar to the original.

Faces synthesized from templates using GAN: Meryl Streep is recognizable, but the image is far from original.
Training database, or a 50% success rate
We have already learned that the efficiency of the neural network algorithm depends on the network architecture, on how it is trained (loss function) and, of course, on the training data- base. In fact, it is very hard to measure accurately the contribution of the training database, which can vary widely from as low as 50% to maybe 80%. The machine learning specialist is usually an engineer, not a scientist. As such, the research process behind machine learning is more like handle turning and tuning, in which the specialist checks whether a given result has gotten better or worse, rather than a consistent and conscious path towards proving a theory. Therefore, each developer can have his own opinion, confirmed by his own empirical obser- vations, on how to collect databases for machine learning, how many images are needed, and what they should be like. However, developers will not often share the details of their opinions because the characteristics of the training database are considered a company’s “know-how” and are a much bigger secret than the architecture of the network. Moreover, the training database itself is a value and an asset. The developer would more likely (and more cheaply) sell you the source code of the algorithm than the training database.
On the Internet you can find a number of open databases with face images: Labeled Faces in the Wild (LFW), YouTube Faces in the Wild (YFW), VGG Faces, CelebA and others. It is even pos- sible to download any of these and try to train your own face recognition algorithm on them. In principle, any student can quickly make a decent algorithm that will recognize faces better than top “traditional” algorithms, written by a team of developers in a big corporation. The difference between the modern top-rated algorithms and “student” algorithms written in 2-3 months lies in the FAR-FRR mistakes ratio. The world’s top algorithms work well when search- ing very large databases (on the order of FAR 10-6, 10-7, 10-8) and working with “difficult” images (low quality, angles, partially closed face, etc.)

When thinking about the training database, one should keep in mind that it works much like the human brain. Namely, if you want the neural network to recognize someone, you need to show it an image of that someone. For example, for a person who has lived all his life sur- rounded by Europeans, it is much more difficult for him/her to distinguish one Asian person from another. This has nothing to do with racism, but rather the fact that the neural networks of those individuals have simply not seen many examples of Asian faces, and as a result, all Asians look rather similar to each other. Put in another way, those individuals’ own neural networks are “poorly trained”. The same thing happens with the machine algorithms for face recognition. If we want our machine algorithms to recognize different nationalities, we have
to “show” these nationalities to the network. Similarly, if we want our machine algorithm to recognize people with glasses, we need to add people with glasses to the training database. By the same token, because children’s faces are different from adult faces, if we want the machine algorithm to recognize and distinguish them, we need to add them both. In fact, collection
and cleaning of the training database has a myriad of subtleties, and even developers do not always know what impact certain changes or inputs will have on the accuracy of the algorithm. The only way to determine their impact is to do repeated testing, and as such, this domain has become the “internal kitchen” of developers. The capabilities and limitations of a given algo- rithm are directly related to the developer’s acuity with respect to the input to the database. Thus, it will not be surprising that the algorithm that has proven itself perfectly, for example,
in dozens of projects in North America, shows poor results when trying to recognize Australian aborigines.
Matching: “How accurate is your algorithm”?
When customers and users of face recognition systems look at a monitor that shows the match of two images, they often are most interested in knowing what the accuracy of the match is. For them 99% represents a “good match” and is indicative of high accuracy in the sys- tem. In contrast, 68% is considered “not such a good match” and deemed to be less accurate. In reality, these percentages have nothing to do with the accuracy of the recognition algorithm. An analogous conundrum can be gleaned from the following conversation between a custom- er and a merchant:
– How much are the shoes?
– 10.
– Ten what?
– Ten shoes.
The reaction to this conversation is that it is all nonsense. Just like the dialogue above does not make clear if the shoes are cheap or expensive, the numbers that you see on the screen after faces have been matched cannot help you draw the conclusion of whether or not an algorithm works well or poorly. Now let’s see what the numbers associated with face matching actually mean, keeping in mind what the accuracy of recognition is actually measuring.

An example of “empty shell” numbers in marketing materials
Biometric systems fall prey to two types of errors classified as false positives and false negatives, known also as a Type I error (FAR, or FMR) or a Type II error (FRR, or FNMR), respectively. The difference can be explained in terms of an everyday example: the efficacy of a security guard at a nightclub. Any such security guard can be judged not only by how well he filters out unwanted visitors, but also by how often he unwittingly “filters out” friends of the owner. When the guard is careless and lets in those he should not, he makes a Type I (FAR) error. However, as a result of his generosity in letting people in, he may also decrease the probability of making a Type II (FRR) error; namely, he decreases the probability of keeping the owner’s friends out. In contrast, if the security guard suddenly becomes more vigilant, the number of FAR errors will decrease because now fewer non-desirables will gain access to the club, but by the same token FRR errors will also increase, and the owner’s friends will never see the inside of the club.
As you can see, FAR and FRR errors are interrelated. The probability of one type of error de- creases the probability of another type of error. This interrelationship between the two types of errors is also true for facial recognition. Facial recognition biometrics never works with absolute preci- sion, and as such, the prioritization of the type of error needs to be assessed. In the case of the nightclub scenario, a low FAR error becomes more important if a club’s license will be revoked if it lets in underage people. In contrast, if the club is on the lookout for a particular person or criminal, then an FRR error becomes more relevant because it is far better to spend an extra 30 seconds than to miss the person of interest. The real efficiency and accuracy of facial rec- ognition algorithms are determined by the ratio of FAR and FRR errors. This ratio is displayed in the form of an ROC curve based on the test results in which each point on the curve corre- sponds to the FRR error value at a certain FAR. For example, the probability that the security guard will accidentally miss a “person of interest” is one in a million, but in so doing the secu- rity guard will have also unintentionally not given access to 1% of the club owner’s friends. In such a scenario, the FRR=1% at FAR=10-6. It is important to remember that the curve itself and all the values at particular points tell us about the accuracy of the algorithm on a particular database from which the results were measured and the curve was drawn.

ROC curves for different algorithms from NIST report
So what do the numbers that we see on the monitor when a match is found actually mean? First, it is important to remember that a biometric template is a vector, or a set of numbers, in multidimensional space. What is meant by multidimensional space? Imagine a point on a plane described by 2 coordinates, x and y. The same point in three-dimensional space will have 3 coordinates, x, y, and z, which describe the point’s position in the world as we know it. The bio- metric template, in contrast, is described by a point with a huge number of coordinates. Since it is extremely difficult to imagine a space with more than three dimensions, it is useful to draw a projection of it in the usual two-dimensional form:

The closer the points are to each other, the more likely it is that the face images described by these biometric templates belong to the same person. The degree of proximity (what in prac- tice we often consider as “similarity” and sometimes try to measure in percent) is the distance between two points, or biometric templates. This distance in multidimensional space is not measured in meters, or minutes, or any other unit of measure familiar to us. It is completely abstract. This value represents a specific distance (L2 distance) that is then converted into a number by using one of many different calculations. It is this number that indicates “the de- gree of similarity” and the number that will be shown on the monitor. It can be a ratio between 0 and 1, a scale from 1 to 100%, or just a number. What is useful to remember is that numbers issued by different recognition algorithms cannot be compared with each other.
So, then why are these numbers shown to a user if they mean nothing? For the purpose of identification (1:N match), especially for large databases, it is more convenient to use Rank
on practice, in other words, the TOP 3 of best matches, TOP 10, TOP 50, etc. If the person is
in the database, and if the algorithm is a good one, their image should be on top or in the top no matter what the number on the monitor is. However, for the purpose of verification (1:1 match), a threshold must be set in order for the system to be able to decide whether or not to let a person into a guarded facility or a user into a mobile application. So what is the best way to choose a threshold?
In the Ideal scenario, the best method would involve running a test on your database or on part of it. First, you need to determine the values of errors that are acceptable in your particular case. For example, if you periodically run images against your 10M database, you probably would pre- fer less than 1 false match. This means you need to set your FAR at 10-7 or 10-8. Run the test on a portion of your database, where when you match genuines and impostors you obtain a total number of matches that are 1-2 orders of magnitude higher than the FAR you are interested in. For example, given 1M genuines and 1,000 impostors or 100K genuines and 10K impostors, the total number of matches would be 109. Plot the ROC curve with the error distribution by FAR
and FRR, look at the error percentage by FRR and FAR, and select the FAR that you think is most appropriate in your case. Then, plot a curve of the distribution of scores (each vendor has its own abstract number) from FAR. Finally, identify what score you have at a certain FAR, and based on it, choose the score. That score will represent your threshold.
If the described scenario is too complicated or carrying out such an analysis is too difficult, you can also choose the score empirically during the system’s test period. In this case, you just need to test and see what score you have on the faces of the same person, and compare it to the score for different people. Test “difficult” images, such as those with poor quality, big angles, with glasses and other artifacts, low resolution, age gap, etc. On the basis of empirical observations select the desired threshold. In most cases, the vendor can also give you tips on choosing a score and help you run tests.
What is important to always keep in mind is that:
- It is impossible to compare the algorithms of different vendors solely on the basis of scores because all vendors measure the score differently.
- The thresholds for each database are selected separately. There are general guidelines, of course, but if your database changes dramatically, for exam- ple, instead of passport photos of adult Europeans it is suddenly made up of low-quality CCTV images from around the world, the selected score will likely have to be revised after a database update.
Also noteworthy is the fact that though L2, or the distance between vectors describing bio- metric patterns, is the most popular way to match templates primarily due to the simplicity of calculations, and, consequently, the high speed of processing, it is certainly not the only way. For example, you can train a separate neural network for matching by giving it templates from both one person and different people as a training dataset.
How to evaluate algorithms
- Do not estimate the numbers separately from the database.
Whenever you look at the error values for FAR-FRR (FMR-FNMR), ask on what database they were measured. For example, if you see an accuracy of 99.8% (FRR=0.002) at FAR= 10-6, you may consider this to be a good result; however, these numbers may have been obtained when matching passport photos against passport photos. If we start working with other types of images, for example, from cheap CCTV cameras, the error rate can be quitedifferent. The rule of thumb is to relate the FAR and FRR values to the complexity of the database.Note: in marketing materials, vendors often cite values measured on well-known open databases, for example, LFW (labeled faces in the wild dataset). On the one hand, it is under- standable that it is suboptimal to refer to “one’s own private non-disclosed database”, but
on the other hand, it is important to remember that such figures do not serve as proof for a serious comparison between algorithms. At the very least this is the case because you can always add an open database to the training dataset and then easily demonstrate impressive accuracy on it. - Never evaluate the accuracy of the algorithm on the basis of a few examples.If someone shows you a photo of such poor quality that you would hardly recognize you own mother on it, and then proceeds to run it against a huge police database, using two different algorithms but only one of the algorithms was able to find a match, it does not necessarily mean that one algorithm is better than the other. It is equally likely that the second algorithm would succeed better than the first with another photo. Few examples ofcorrect matches say nothing. In order to compare algorithms, the testing must be repre- sentative. In other words, there must be evidence from hundreds or thousands of match- es, and if possible even millions, but certainly not just a few.
- Consider the peculiarities of your database.This point is particularly true if you have a large database, consisting of millions, tens of millions, or even hundreds of millions of people. As mentioned previously, different algo- rithms can be sensitive to specific races, nationalities, and ages (specifically children and elderly people). Any decent algorithm can handle a small, “simple” database, but on large databases with millions of images large spreads in accuracy, even among the world’s topalgorithms and inexpensive algorithms that you could find in Google context advertizing, are not uncommon. A good algorithm should be invariant to gender, age and different nations.
- Test on your database, if you have one.Any self-respecting vendor will never refuse you a test license to try the algorithm.
- Identify international ratings.
As of 2019, the most well-known independent and reputable rating comes from the US Nation- al Institute of Standard and Technology (NIST). NIST conducts several contests for face recogni- tion algorithms:
- Ongoing FRVT – for 1:1 verification
- FRVT 1:N, which had several phases during 2017-2018 and closed in 2018. The contest is expected to open again in 2019.
NIST ratings are trustworthy and reputable because the database is closed to all participants, guaranteeing objectivity and inability to influence the result.
Despite the popularity and authority of the NIST, several things must be kept in mind when obtaining true comprehensive analyses of algorithms:
- Results on NIST do not guarantee similar results on your database. NIST does reveal certain characteristics of its datasets; however, the more specific your database is, the more likely your results will vary from those of NIST. For exam- ple, if the algorithm recognizes adults very well, good recognition of children is not guaranteed. If your use case is about face recognition of Junior high school students, beyond NIST ratings, additional assessments need to be considered.
- NIST publish the leaderboard based on “medium score” across the datasets. Each dataset is unique and has its own peculiarities. For example, Visa dataset is only fully frontal ID images. It looks like its simple, but its’ not: this dataset can contain the images with huge age gap and very low quality. On the other hand Wild dataset looks like the most complicated one, but it consists of imag- es of celebs and public persons. It gives the possibility to train the algorithm on these persons from open datasets, “memorize” it and – as the result – to show very good accuracy on it. But when you run the same algorithm in the real use cases this high accuracy can fade away. If you choose a different point, the leaderboard may change. However, you must keep in mind that one point is no better than another. In addition, if your databases are huge and you need to work on low FAR, then you must focus not only on the leaderboard, but also on the graphs and curves.
- NIST is not immune to human mistakes.
Conclusion
The intent of this article was to provide a “user friendly” overview of what goes into finding a face in an image and recognizing it. We have come a long way since pioneers in the field of machine vision first blazed the trail in the early 90s. Today, we rely on sophisticated neural net- works that literally develop “minds of their own” when set to the task of automatically recogniz- ing a face. The manner in which these neural networks accomplish their task remains a “black box” of sorts. However, understanding their inner workings is not necessary for the consumer to assess the capabilities of the different algorithms. This is particularly true given the fact that facial recognition biometrics and the machine learning industry is constantly evolving at such a fast pace that some information can become obsolete even within 6-12 months of its dissemination. In fact, today, technology that was only an idea 1 year ago is now a reality.
1 – A color’s RGB value indicates its red, green, and blue intensity. Each intensity value is on a scale of 0 to 255, or in hexadecimal from 00 to FF. RGB values are used in HTML, XHTML, CSS, and other web standards.
More about this : Touchless Biometric Technologies and Innovative Solutions for Covid-19